A worked example for comparing capacity, traffic and occupancy without confusing passengers with profit.
Capacity and traffic use different denominators
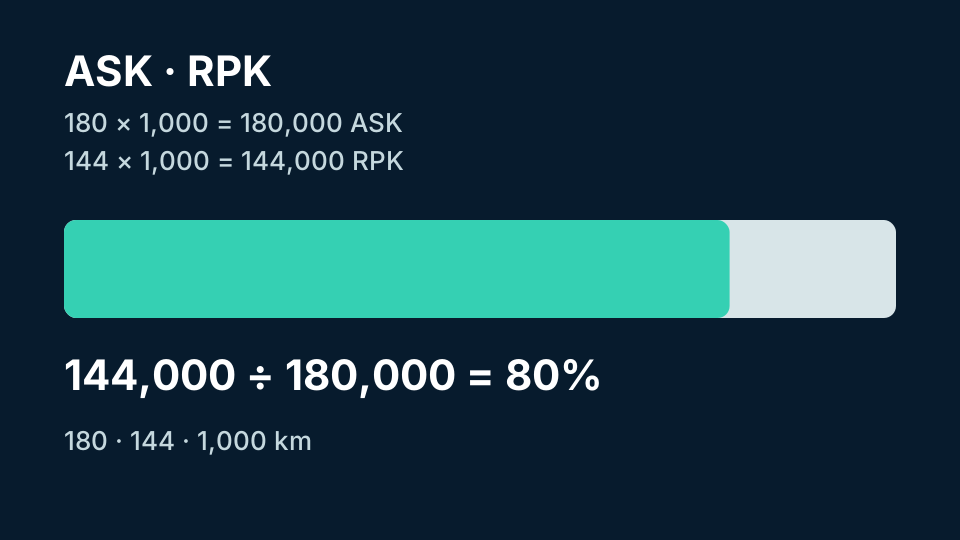
Consider a hypothetical 1,000 km flight with 180 offered seats and 144 paying passengers. Capacity is 180 × 1,000 = 180,000 available seat kilometres (ASK). Traffic is 144 × 1,000 = 144,000 revenue passenger kilometres (RPK). Passenger load factor is RPK ÷ ASK = 80%. These are illustrative figures, not the performance of a real carrier.
Why an average of percentages can mislead
For a network, add the RPK of every flight and divide by total ASK. Do not average route percentages unless their capacity weights are identical. A long flight with many seats contributes more ASK than a short regional service. Similarly, passenger growth and RPK growth can diverge if the average journey becomes shorter.
Occupancy is not a profit margin
A full aircraft can lose money if revenue is low or costs are high. Yield describes passenger revenue per RPK; unit cost and unit revenue need a consistent scope, such as costs or revenue per ASK. Before comparing airlines, check distance, reporting period, currency, cargo contribution and exceptional costs. Review punctuality and cancellations separately: load factor does not measure service reliability.

International Flight News separates verified facts, durable context and editorial analysis. Time-sensitive reports identify their primary sources, publication date and material updates.